It’s clear that Metro Vancouver is in a housing market slowdown, with listings piling up this has become an excellent opportunity for Buyers to grab excellent deals.
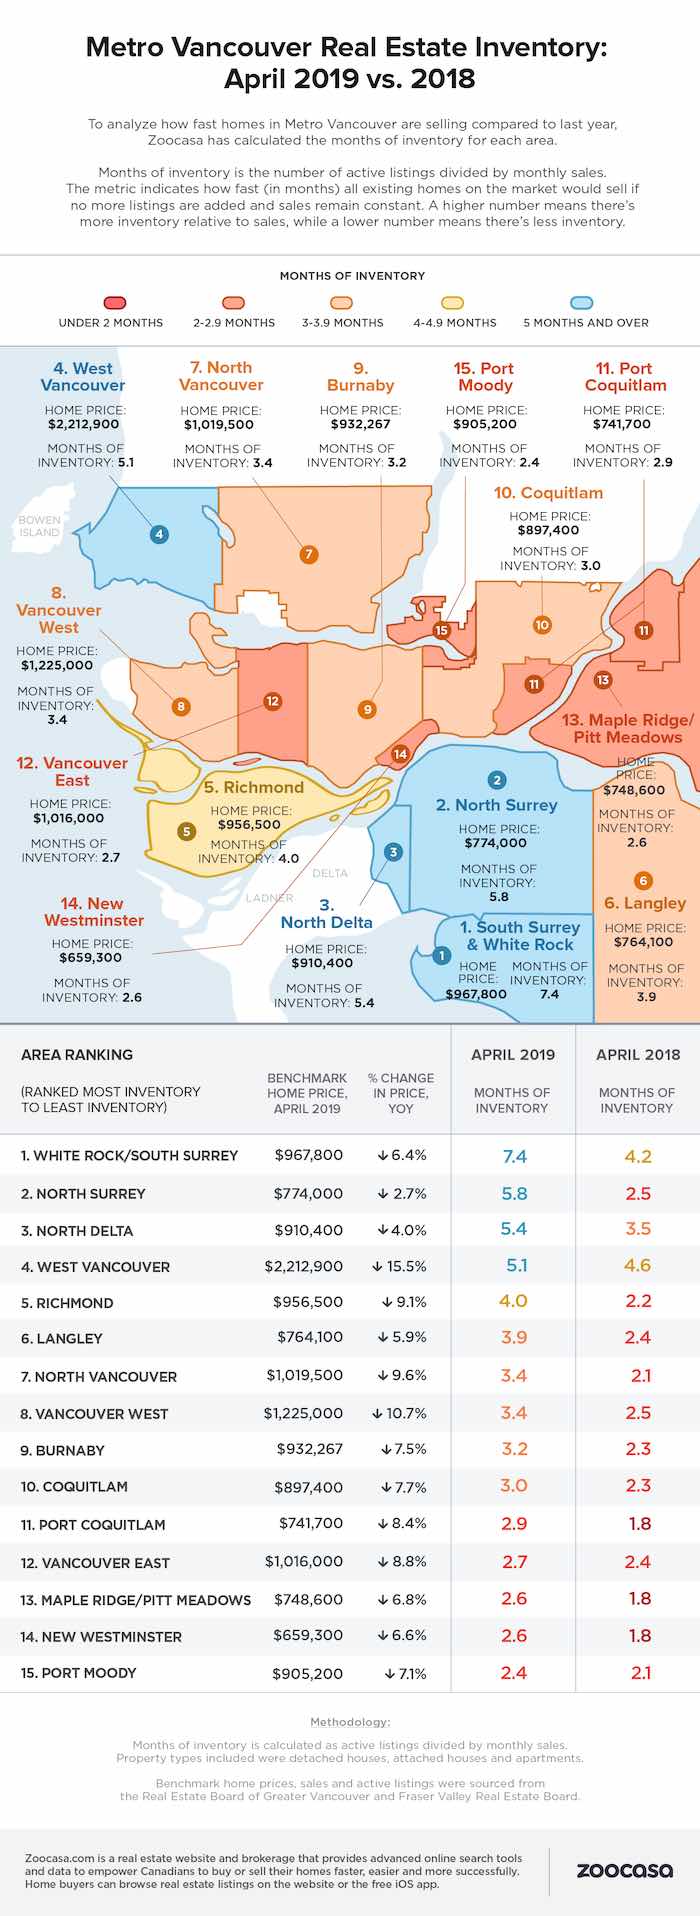
So how does this break down by municipality, and where is the deepest inventory?Real estate website Zoocasa created an infographic map of the region, ranking each area by how many months of resale inventory is on the market as of April – and the results may surprise you.Rather than West Vancouver or Vancouver West seeing the biggest build-up of listings, it is White Rock/South Surrey where sellers are having the most trouble, with a whopping 7.4 months of inventory. (This means that it would take 7.4 months to sell all the homes on the MLS at the current sales rate.)White Rock/South Surrey was followed by North Surrey and North Delta, at 5.8 and 5.4 months of inventory respectively.West Vancouver came in fourth at 5.1 months, although it has seen the biggest year-over-year price decline of the region.Out of 15 municipalities, Port Moody was the city to see the greatest absorption of new home inventory, with just 2.4 months of inventory on its MLS.The infographic also lists the inventory levels from one year previously for comparison, as well as each area’s composite benchmark home price and year-over-year price decline.Check out the full ranking of 15 municipalities in the infographic below.
So how does this break down by municipality, and where is the deepest inventory?Real estate website Zoocasa created an infographic map of the region, ranking each area by how many months of resale inventory is on the market as of April – and the results may surprise you.Rather than West Vancouver or Vancouver West seeing the biggest build-up of listings, it is White Rock/South Surrey where sellers are having the most trouble, with a whopping 7.4 months of inventory. (This means that it would take 7.4 months to sell all the homes on the MLS at the current sales rate.)White Rock/South Surrey was followed by North Surrey and North Delta, at 5.8 and 5.4 months of inventory respectively.West Vancouver came in fourth at 5.1 months, although it has seen the biggest year-over-year price decline of the region.Out of 15 municipalities, Port Moody was the city to see the greatest absorption of new home inventory, with just 2.4 months of inventory on its MLS.The infographic also lists the inventory levels from one year previously for comparison, as well as each area’s composite benchmark home price and year-over-year price decline.Check out the full ranking of 15 municipalities in the infographic below.